How we understand poverty, inequality, or financial hardship is highly dependent on how we choose to measure it. Alec Haglund, IF Researcher, discusses the insights that a newly developed poverty metric might bring to our understanding of intergenerational inequality.

The new ‘Below Average Resources’ metric
Based on recommendations made by the Social Metrics Commission, an independent Commission formed to develop a new approach to poverty measurement that better reflects the nature and experiences of poverty that different families in the UK have, the Department for Work and Pensions (DWP) are developing a new metric for measuring poverty called ‘Below Average Resources’ (BAR).
Unlike existing metrics, such as the commonly used ‘Households Below Average Income’ (HBAI), the BAR metric takes a more holistic view of available resources by incorporating savings, assets, inescapable costs, and debts.
The creators of the new metric argue that while the HBAI metric includes measures of food insecurity and material deprivation, its focus on income might obscure some significant aspects of poverty that can be better understood when a more expansive view of resources is measured.
Poverty remains high
Analysis by the Joseph Rowntree Foundation (JRF) reveals that poverty grew rapidly under Margaret Thatcher and peaked at around one quarter of the population in the 1990s. While poverty fell slightly during the beginning of the 2005 Labour government, the proportion of the population in poverty has remained between 20% and 22% since then.
There are now approximately 8.1 million working-age adults, 4.2 million children and 2.1 million pensioners living in poverty in the UK.
How poverty is changing
IF has analysed the changing face of poverty and equality by age for over a decade. An ageing population, a housing crisis, stagnating real wages and the retreat of the welfare state from the young and those in work has had significant impacts on the economic wellbeing of younger generations.
Pensioner poverty has fallen steadily, with pensioners now the least likely age group to be in poverty. While falling levels of pensioner poverty should be celebrated, work is urgently required to rapidly reduce the much higher levels of child and working-age poverty.
Children faring worse than older generations
Even if the BAR measure is not yet fully developed, initial results provide a new perspective on UK poverty and how it has changed over the past 20 years.
The graph below reveals the percentage of children that are in low resources (red line) or low income (blue line). As the data demonstrates, the percentage of children who are in low resources has been consistently higher than the percentage of children suffering from low income. In 2022, as many as 34% of all children in the UK were in low resources, and 29% were in low income.
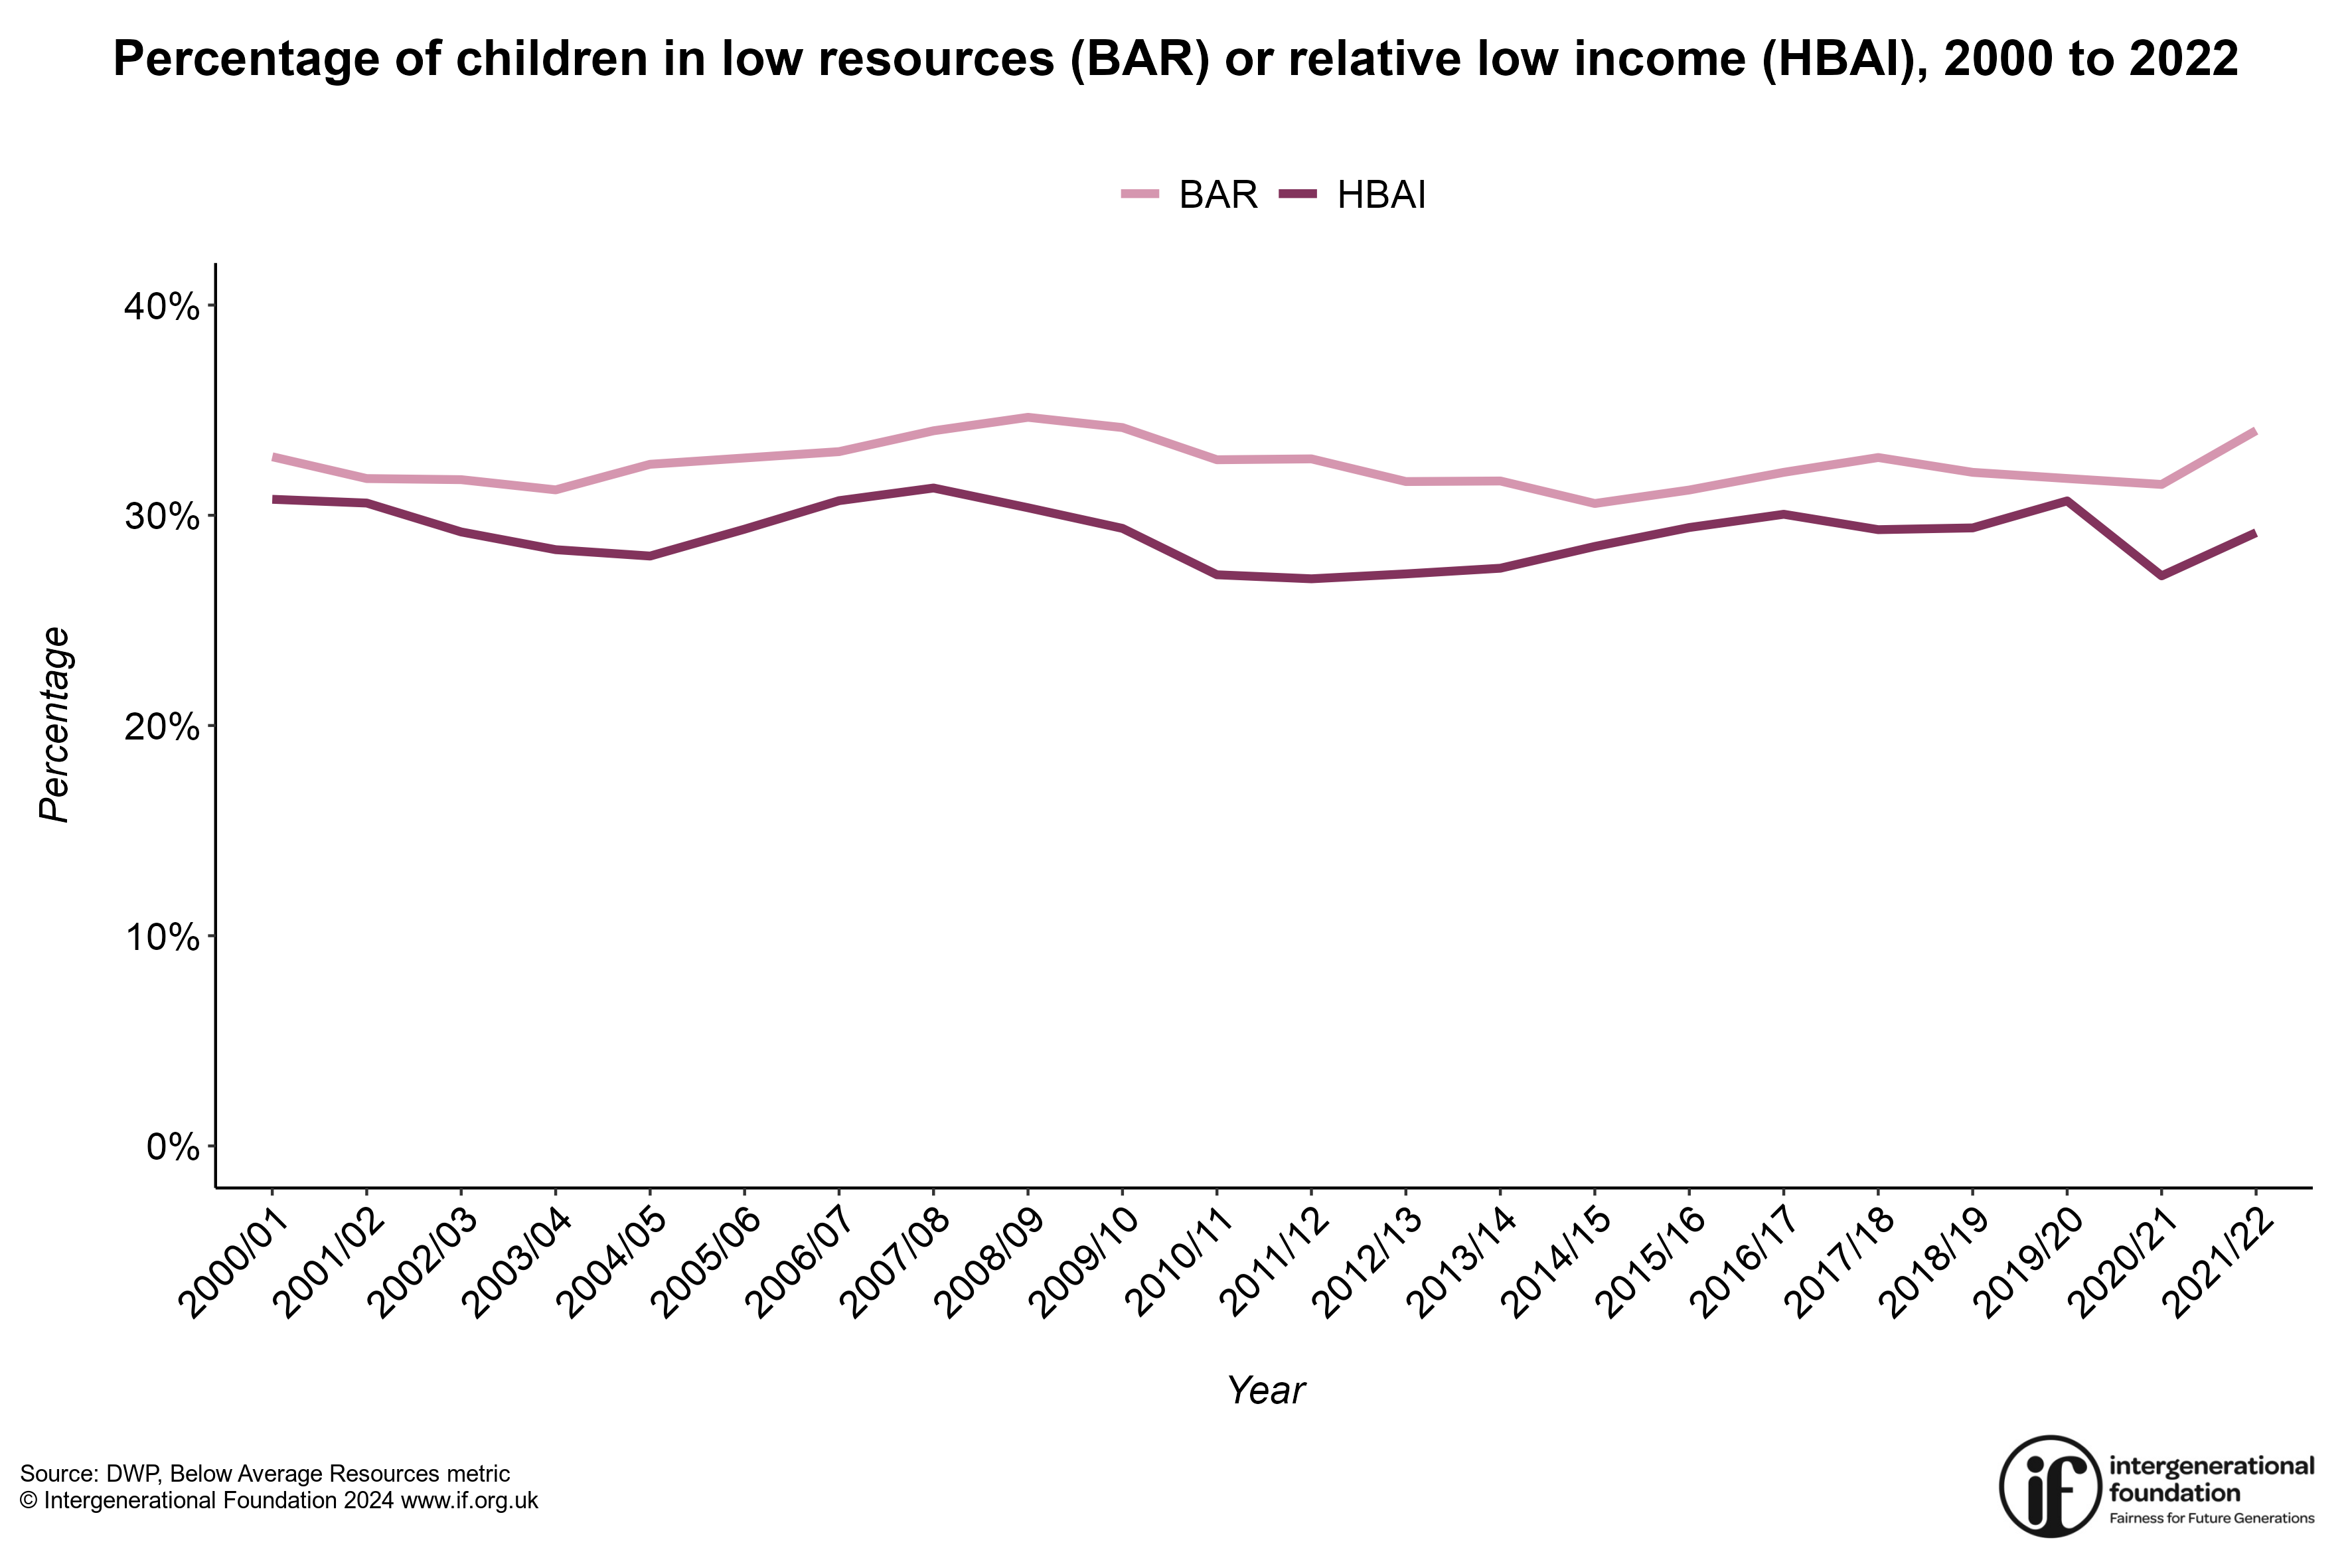
The data suggests that this new metric, which takes a more holistic view of resources available, shows that the level of financial or economic hardship faced by children may be underestimated when analysed using primarily income-based metrics.
For those of pension age, a comparison of the BAR metric with the HBAI metric shows the reverse to that seen for children. Pensioner poverty has fallen steadily. However, the proportion of the population of pension age that are in low resources has consistently been lower than the proportion who are in low income. In other words, only 13% of pensioners were in low resources in 2022, while 18% were in low income.
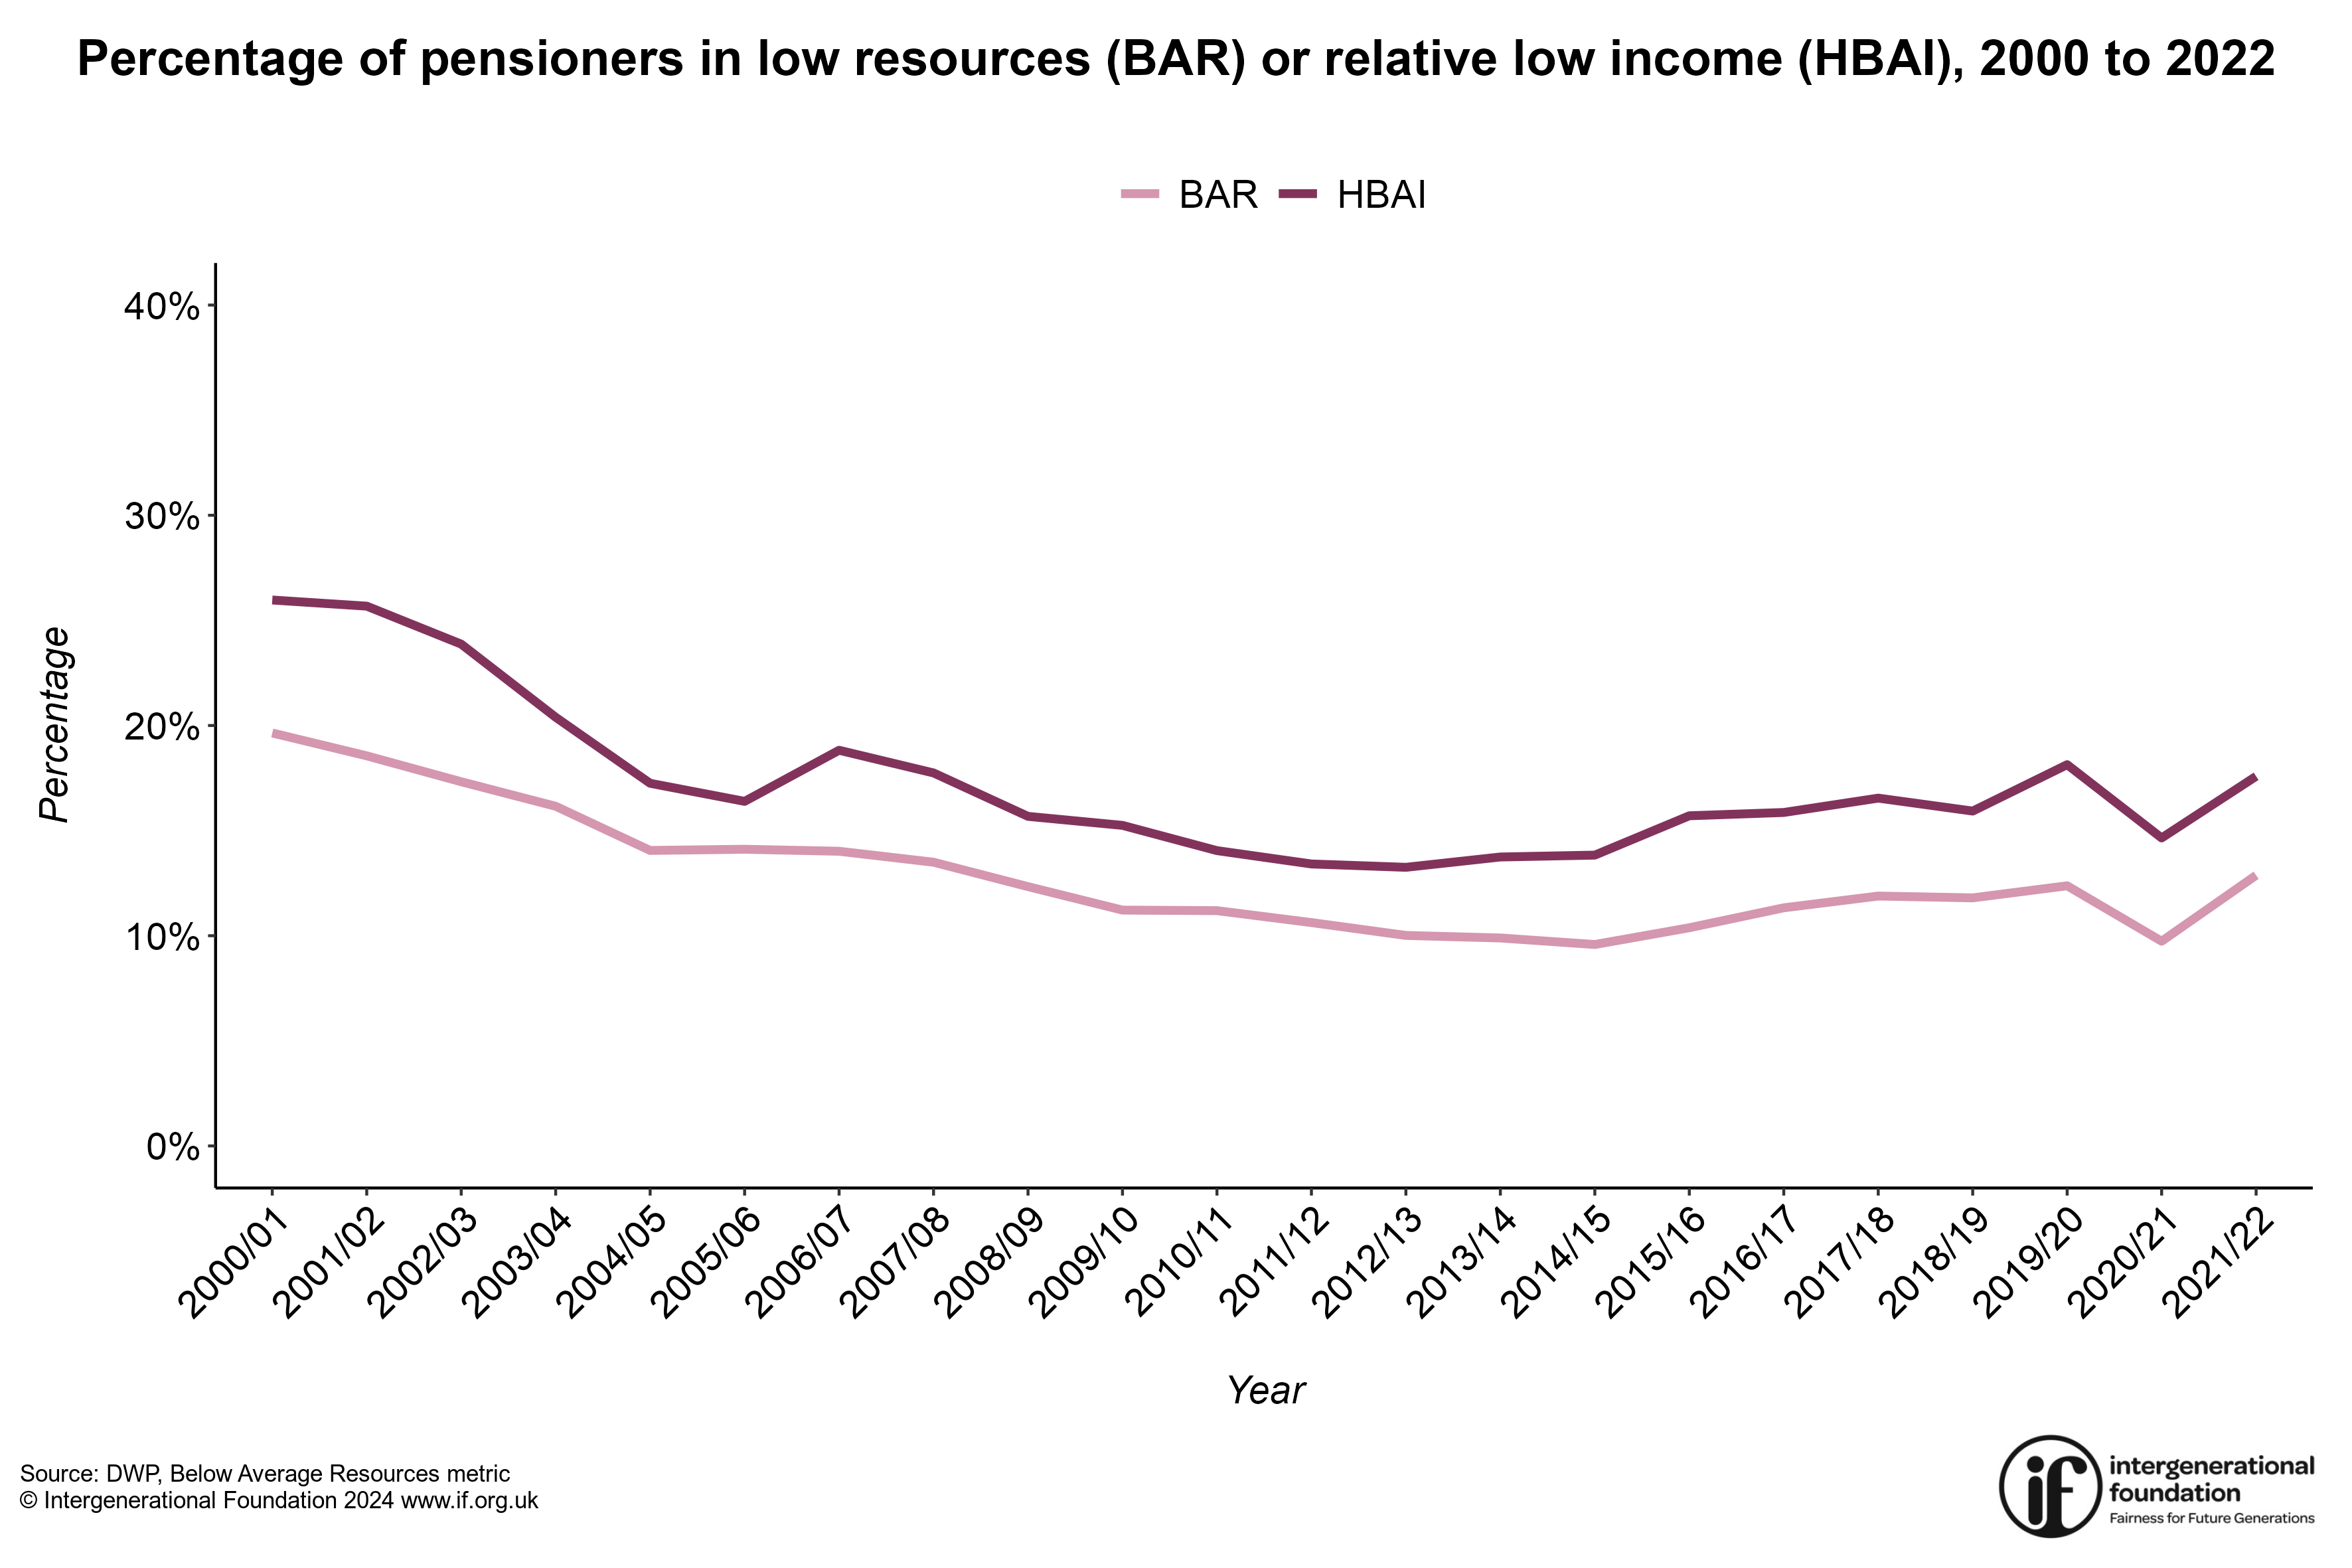
It must be noted that the data released is not the final version of the BAR metric, and as of now, the costs of debts or social care are yet to be incorporated. However, it is clear that the BAR metric is a valuable addition for those wishing to better understand what poverty looks like today.
Widening gaps?
For those of working age, the difference in the number of people who are in low resources and those who are in low income is very small. However, when comparing pensioners and children, it is clear that pensioners are faring better than children with the gap widening.
The percentage of children in low income in 2022 is 29%, while the percentage of pensioners in low income is 18%, which is a difference of 11 percentage points. However, the percentage of children in low resources in 2022 is 34%, but only 13% of pensioners are in low resources, meaning that the difference is as large as 21 percentage points.
This shows the importance of understanding poverty from a holistic perspective and using different measures instead of only relying on one metric. The work undertaken to create the new Below Average Resources metric is very valuable for those who care about intergenerational inequalities, as it shows that we might underestimate the generational differences in poverty if we do not take a more expansive and holistic view on access to resources beyond focusing on income.
Help us to be able to do more
Now that you’ve reached the end of the article, we want to thank you for being interested in IF’s work standing up for younger and future generations. We’re really proud of what we’ve achieved so far. And with your help we can do much more, so please consider helping to make IF more sustainable. You can do so by following this link: Donate.